

Question: (a) A potato is put in an oven to bake at time t = 0. Which of the graphs in Figure 1.7 could represent the
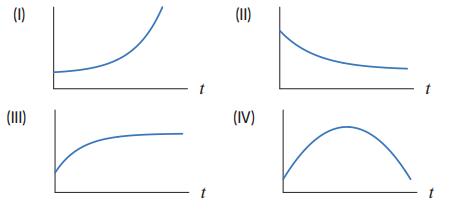
(a) A potato is put in an oven to bake at time t = 0. Which of the graphs in Figure 1.7 could represent the potato’s temperature as a function of time?
(b) What does the vertical intercept represent in terms of the potato’s temperature?
Figure 1.7
(1) (11) (IV) t
Step by Step Solution
★★★★★
3.42 Rating (165 Votes )
There are 3 Steps involved in it
1 Expert Approved Answer
Step: 1 Unlock

a Since the potato is getting hotter the temperature is inc... View full answer
Question Has Been Solved by an Expert!
Get step-by-step solutions from verified subject matter experts
Step: 2 Unlock
Step: 3 Unlock