

Question: A congressional committee is investigating a defense contractor whose projects often incur cost overruns. The data in Table 7.7 show y, the fraction of the
A congressional committee is investigating a defense contractor whose projects often incur cost overruns. The data in Table 7.7 show y, the fraction of the projects with an overrun of at most C%.
(a) Plot the data with C on the horizontal axis. Is this a density function or a cumulative distribution function? Sketch a curve through these points.
(b) If you think you drew a density function in part (a), sketch the corresponding cumulative distribution function on another set of axes. If you think you drew a cumulative distribution function in part (a), sketch the corresponding density function.
(c) Based on the table, what is the probability that there will be a cost overrun of 50% or more? Between 20% and 50%? Near what percent is the cost overrun most likely to be?
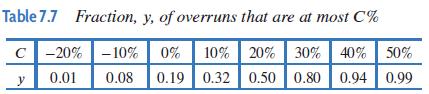
Table 7.7 Fraction, y, of overruns that are at most C% C -20% -10% 0% 10% 20% 30% 40% 50% 0.01 0.08 0.19 0.32 0.50 0.80 0.94 0.99 y
Step by Step Solution
3.38 Rating (154 Votes )
There are 3 Steps involved in it
a See Figure 713 This is a cumulative distribution function b The dens... View full answer

Get step-by-step solutions from verified subject matter experts