

Question: A sample of radioactive material decays over time (measured in hours) with decay constant .2. The graph of the exponential function y = P(t) in
A sample of radioactive material decays over time (measured in hours) with decay constant .2. The graph of the exponential function y = P(t) in Fig. 7 gives the number of grams remaining after t hours.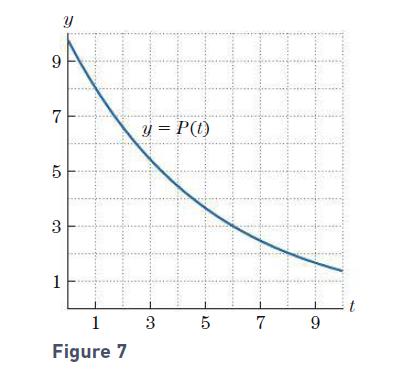
(a) How much was remaining after 1 hour?
(b) Approximate the half-life of the material.
(c) How fast was the sample decaying after 6 hours?
(d) When was the sample decaying at the rate of .4 grams per hour?
9 7 5 3 1 y 1 Figure 7 y = P(1) 3 5 7 9
Step by Step Solution
3.40 Rating (175 Votes )
There are 3 Steps involved in it
a From the graph P1 8 grams b From the g... View full answer

Get step-by-step solutions from verified subject matter experts