

Question: (a) What are the equilibrium price and quantity for the supply and demand curves in Figure 6.39? (b) Shade the areas representing the consumer and
(a) What are the equilibrium price and quantity for the supply and demand curves in Figure 6.39?
(b) Shade the areas representing the consumer and producer surplus and estimate them.
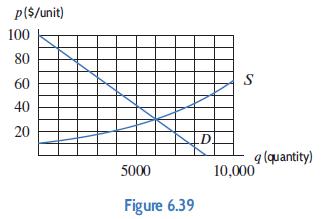
p($/unit) 100 80 60 40 20 5000 Figure 6.39 _D S q (quantity) 10,000
Step by Step Solution
★★★★★
3.33 Rating (162 Votes )
There are 3 Steps involved in it
1 Expert Approved Answer
Step: 1 Unlock

a The equilibrium price is 30 per unit and the equilibrium quantity is 6000 b The region repr... View full answer
Question Has Been Solved by an Expert!
Get step-by-step solutions from verified subject matter experts
Step: 2 Unlock
Step: 3 Unlock