

Each of the contour diagrams in Figure 8.32 shows population density in a certain region. Choose the
Question:
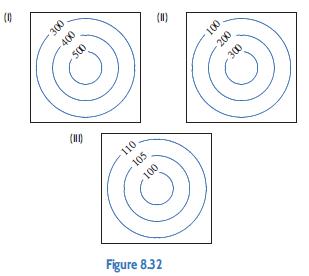
Each of the contour diagrams in Figure 8.32 shows population density in a certain region. Choose the contour diagram that best corresponds to each of the following situations. Many different matchings are possible. Pick any reasonable one and justify your choice.
(a) The center of the diagram is a city.
(b) The center of the diagram is a lake.
(c) The center of the diagram is a power plant.
Fantastic news! We've Found the answer you've been seeking!
Step by Step Answer:
One possible answer follows a If there is a city at the center of the diagram then the population is ...View the full answer

Answered By
Elias Gichuru
am devoted to my work and dedicated in helping my clients accomplish their goals and objectives,providing the best for all tasks assigned to me as a freelancer,providing high quality work that yields high scores.promise to serve them earnestly and help them achieve their goals.i have the needed expertise,knowledge and experience to handle their tasks.
325+ Reviews
859+ Question Solved
Related Book For 

Applied Calculus
ISBN: 9781119275565
6th Edition
Authors: Deborah Hughes Hallett, Patti Frazer Lock, Andrew M. Gleason, Daniel E. Flath, Sheldon P. Gordon, David O. Lomen, David Lovelock, William G. McCallum, Brad G. Osgood, Andrew Pasquale
Question Posted:
