

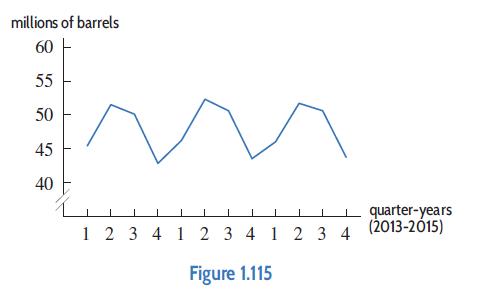
Figure 1.115 shows quarterly US beer production during the period 2013 to 2015. Quarter 1 reflects production
Question:
Figure 1.115 shows quarterly US beer production during the period 2013 to 2015. Quarter 1 reflects production during the first three months of each year, etc.
(a) Explain why a periodic function should be used to model these data.
(b) Approximately when does the maximum occur? The minimum? Why does this make sense?
(c) What are the period and amplitude for these data?
Fantastic news! We've Found the answer you've been seeking!
Step by Step Answer:
a The graph looks like a periodic function because ...View the full answer

Answered By
PU Student
cost accounting
financial accounting
auditing
internal control
business analyst
tax
i have 3 years experience in field of management & auditing in different multinational firms. i also have 16 months experience as an accountant in different international firms. secondary school certification.
higher secondary school certification.
bachelors in mathematics.
cost & management accountant
4+ Reviews
10+ Question Solved
Related Book For 

Applied Calculus
ISBN: 9781119275565
6th Edition
Authors: Deborah Hughes Hallett, Patti Frazer Lock, Andrew M. Gleason, Daniel E. Flath, Sheldon P. Gordon, David O. Lomen, David Lovelock, William G. McCallum, Brad G. Osgood, Andrew Pasquale
Question Posted:
