

Figure 1.72 shows graphs of several cities populations against time. Match each of the following descriptions to
Question:
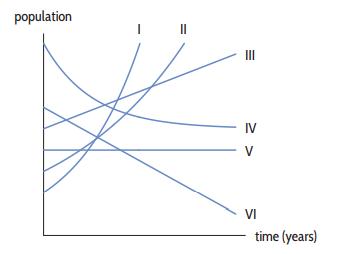
Figure 1.72 shows graphs of several cities’ populations against time. Match each of the following descriptions to a graph and write a description to match each of the remaining graphs.
(a) The population increased at 5% per year.
(b) The population increased at 8% per year.
(c) The population increased by 5000 people per year.
(d) The population was stable.
Figure 1.72
Fantastic news! We've Found the answer you've been seeking!
Step by Step Answer:
a The citys population is increasing at 5 per year It is growing exponentially Thus it must be eithe...View the full answer

Answered By
SABARI P R S
My name is Ajith. I have completed my graduation from Mahatma Gandhi University Kottayam and also completed certificate of computer application with two year experience.
0 Reviews
10+ Question Solved
Related Book For 

Applied Calculus
ISBN: 9781119275565
6th Edition
Authors: Deborah Hughes Hallett, Patti Frazer Lock, Andrew M. Gleason, Daniel E. Flath, Sheldon P. Gordon, David O. Lomen, David Lovelock, William G. McCallum, Brad G. Osgood, Andrew Pasquale
Question Posted:
