

Question: Figure 4 contains the solution of the initial-value problem in Exercise 23. (a) With the help of the graph, approximate how long it will take
Figure 4 contains the solution of the initial-value problem in Exercise 23.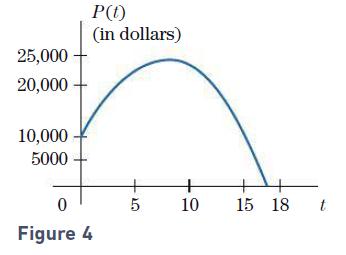
(a) With the help of the graph, approximate how long it will take before the account is depleted.
(b) Solve the initial-value problem to determine P(t).
(c) Use the formula for P(t) to verify your answer in part (a) with the help of a calculator.
25,000 20,000 10,000 5000 P(t) (in dollars) 0 Figure 4 5 + 10 15 18 t
Step by Step Solution
★★★★★
3.35 Rating (155 Votes )
There are 3 Steps involved in it
1 Expert Approved Answer
Step: 1 Unlock

a The graph crosses the taxis at about 17 The account will be empty in abo... View full answer
Question Has Been Solved by an Expert!
Get step-by-step solutions from verified subject matter experts
Step: 2 Unlock
Step: 3 Unlock