

Figure 4.101 shows drug concentration curves after oral administration of 0.5 mg of four digoxin products. All
Question:
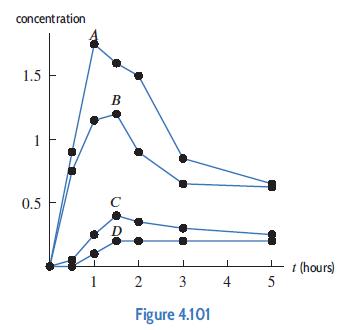
Figure 4.101 shows drug concentration curves after oral administration of 0.5 mg of four digoxin products. All the tablets met current USP standards of potency, disintegration time, and dissolution rate.(a) Discuss differences and similarities in the peak concentration and the time to reach peak concentration.
(b) Give possible values for minimum effective concentration and maximum safe concentration that would make Product C or Product D the preferred drug.
(c) Give possible values for minimum effective concentration and maximum safe concentration that would make Product A the preferred drug.
Step by Step Answer:
a Products A and B have much higher peak concentrations than products C and ...View the full answer


Applied Calculus
ISBN: 9781119275565
6th Edition
Authors: Deborah Hughes Hallett, Patti Frazer Lock, Andrew M. Gleason, Daniel E. Flath, Sheldon P. Gordon, David O. Lomen, David Lovelock, William G. McCallum, Brad G. Osgood, Andrew Pasquale
