

Figure 4.102 shows a graph of the percentage of drug dissolved against time for four tetracycline products
Question:
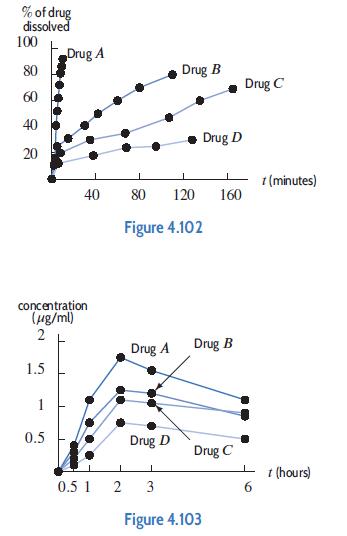
Figure 4.102 shows a graph of the percentage of drug dissolved against time for four tetracycline products A, B, C, and D. Figure 4.103 shows the drug concentration curves for the same four tetracycline products. Discuss the effect of dissolution rate on peak concentration and time to reach peak concentration.
Fantastic news! We've Found the answer you've been seeking!
Step by Step Answer:
The dissolution rate of a drug refers to how quickly it dissolves and becomes available for absorption in the body In the context of tetracycline prod...View the full answer

Answered By
User l_917591
As a Business Management graduate from Moi University, I had the opportunity to work as a tutor for undergraduate students in the same field. This experience allowed me to apply the theoretical knowledge I had gained in a practical setting, while also honing my teaching and communication skills.
As a tutor, I was responsible for conducting tutorial sessions, grading assignments and exams, and providing feedback and support to my students. I also assisted with the preparation of course materials and collaborated with other tutors and professors to ensure consistency in teaching and assessment.
0 Reviews
10+ Question Solved
Related Book For 

Applied Calculus
ISBN: 9781119275565
6th Edition
Authors: Deborah Hughes Hallett, Patti Frazer Lock, Andrew M. Gleason, Daniel E. Flath, Sheldon P. Gordon, David O. Lomen, David Lovelock, William G. McCallum, Brad G. Osgood, Andrew Pasquale
Question Posted:
