

Question: Figure 4.48 in Section 4.4 shows the points, q 1 and q 2 , where marginal revenue equals marginal cost.(a) On the graph of the
Figure 4.48 in Section 4.4 shows the points, q1 and q2, where marginal revenue equals marginal cost.(a) On the graph of the corresponding total cost and total revenue functions in Figure 4.53, label the points q1 and q2. Using slopes, explain the significance of these points.(b) Explain in terms of profit why one is a local minimum and one is a local maximum.
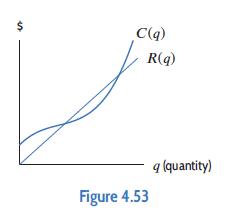
C(q) R(q) Figure 4.53 q (quantity)
Step by Step Solution
3.44 Rating (157 Votes )
There are 3 Steps involved in it
a See Figure 4107 We find q 1 and q 2 by checking to see where the slope of the tangent line to Cq is equal to the slope of Rq Because the slopes of C... View full answer

Get step-by-step solutions from verified subject matter experts