

Figure 4.85 shows the concentration of nicotine in the blood during and after smoking a cigarette. Figure
Question:
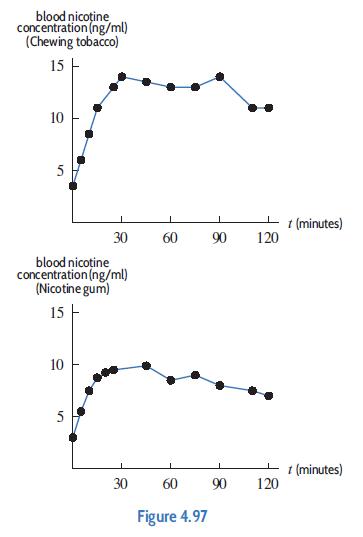
Figure 4.85 shows the concentration of nicotine in the blood during and after smoking a cigarette. Figure 4.97 shows the concentration of nicotine in the blood during and after using chewing tobacco or nicotine gum. (The chewing occurred during the first 30 minutes and the experimental data shown represent the average values for ten patients.) Compare the three nicotine concentration curves (for cigarettes, chewing tobacco and nicotine gum) in terms of peak concentration, the time until peak concentration, and the rate at which the nicotine is eliminated from the bloodstream.
Step by Step Answer:
For cigarettes the peak concentration is approximately 17 ng...View the full answer


Applied Calculus
ISBN: 9781119275565
6th Edition
Authors: Deborah Hughes Hallett, Patti Frazer Lock, Andrew M. Gleason, Daniel E. Flath, Sheldon P. Gordon, David O. Lomen, David Lovelock, William G. McCallum, Brad G. Osgood, Andrew Pasquale
