

Figure 5.11 shows the velocity of a car for 0 t 12 and the rectangles
Question:
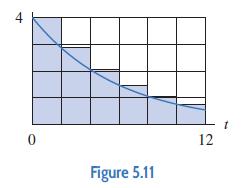
Figure 5.11 shows the velocity of a car for 0 ≤ t ≤ 12 and the rectangles used to estimate the distance traveled.
(a) Do the rectangles represent a left or a right sum?
(b) Do the rectangles lead to an upper or a lower estimate?
(c) What is the value of n?
(d) What is the value of Δt?
(e) Give an approximate value for the estimate.
Fantastic news! We've Found the answer you've been seeking!
Step by Step Answer:
a Left sum b Upper esti...View the full answer

Answered By
GERALD KAMAU
non-plagiarism work, timely work and A++ work
6+ Reviews
11+ Question Solved
Related Book For 

Applied Calculus
ISBN: 9781119275565
6th Edition
Authors: Deborah Hughes Hallett, Patti Frazer Lock, Andrew M. Gleason, Daniel E. Flath, Sheldon P. Gordon, David O. Lomen, David Lovelock, William G. McCallum, Brad G. Osgood, Andrew Pasquale
Question Posted:
