

Figure 5.76 shows the rate of change of the quantity of water in a water tower, in
Question:
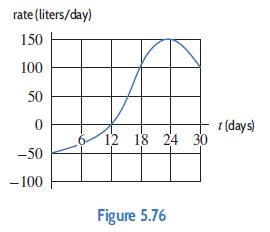
Figure 5.76 shows the rate of change of the quantity of water in a water tower, in liters per day, during the month of April. If the tower had 12,000 liters of water in it on April 1, estimate the quantity of water in the tower on April 30.
Fantastic news! We've Found the answer you've been seeking!
Step by Step Answer:
Suppose Ft represents the total quantity of water in the water tower at time t where t is in days s...View the full answer

Answered By
Utsab mitra
I have the expertise to deliver these subjects to college and higher-level students. The services would involve only solving assignments, homework help, and others.
I have experience in delivering these subjects for the last 6 years on a freelancing basis in different companies around the globe. I am CMA certified and CGMA UK. I have professional experience of 18 years in the industry involved in the manufacturing company and IT implementation experience of over 12 years.
I have delivered this help to students effortlessly, which is essential to give the students a good grade in their studies.
2+ Reviews
10+ Question Solved
Related Book For 

Applied Calculus
ISBN: 9781119275565
6th Edition
Authors: Deborah Hughes Hallett, Patti Frazer Lock, Andrew M. Gleason, Daniel E. Flath, Sheldon P. Gordon, David O. Lomen, David Lovelock, William G. McCallum, Brad G. Osgood, Andrew Pasquale
Question Posted:
