

Figure 5.80 shows the rate of change in the average plasma concentration of the drug Omeprazole (in
Question:
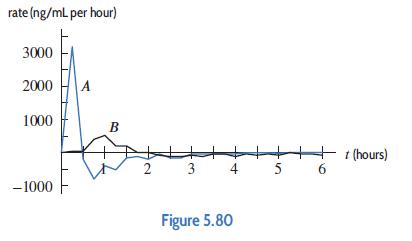
Figure 5.80 shows the rate of change in the average plasma concentration of the drug Omeprazole (in ng/ml per hour) for six hours after the first dose is administered using two different capsules: immediate-release and delayed-release.
(a) Which graph corresponds to which capsule?
(b) Do the two capsules provide the same maximum concentration? If not, which provides the larger maximum concentration?
Fantastic news! We've Found the answer you've been seeking!
Step by Step Answer:
a Graph A achieves its maximum almost immediately after the dose is taken suggesting that the maximu...View the full answer

Answered By
Mugdha Sisodiya
My self Mugdha Sisodiya from Chhattisgarh India. I have completed my Bachelors degree in 2015 and My Master in Commerce degree in 2016. I am having expertise in Management, Cost and Finance Accounts. Further I have completed my Chartered Accountant and working as a Professional.
Since 2012 I am providing home tutions.
2+ Reviews
10+ Question Solved
Related Book For 

Applied Calculus
ISBN: 9781119275565
6th Edition
Authors: Deborah Hughes Hallett, Patti Frazer Lock, Andrew M. Gleason, Daniel E. Flath, Sheldon P. Gordon, David O. Lomen, David Lovelock, William G. McCallum, Brad G. Osgood, Andrew Pasquale
Question Posted:
