

Figure 6.8 shows the rate of change of the concentration of adrenaline, in micrograms per milliliter per
Question:
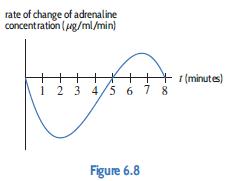
Figure 6.8 shows the rate of change of the concentration of adrenaline, in micrograms per milliliter per minute, in a person’s body. Sketch a graph of the concentration of adrenaline, in micrograms per milliliter, in the body as a function of time, in minutes.
Fantastic news! We've Found the answer you've been seeking!
Step by Step Answer:
The rate of change is negative for t 5 and positive for t 5 so the concentration o...View the full answer

Answered By
Hemstone Ouma
"Hi there! My name is Hemstone Ouma and I am a computer scientist with a strong background in hands-on experience skills such as programming, sofware development and testing to name just a few. I have a degree in computer science from Dedan Kimathi University of Technology and a Masters degree from the University of Nairobi in Business Education. I have spent the past 6 years working in the field, gaining a wide range of skills and knowledge. In my current role as a programmer, I have had the opportunity to work on a variety of projects and have developed a strong understanding of several programming languages such as python, java, C++, C# and Javascript.
In addition to my professional experience, I also have a passion for teaching and helping others to learn. I have experience as a tutor, both in a formal setting and on a one-on-one basis, and have a proven track record of helping students to succeed. I believe that with the right guidance and support, anyone can learn and excel in computer science.
I am excited to bring my skills and experience to a new opportunity and am always looking for ways to make an impact and grow as a professional. I am confident that my hands-on experience as a computer scientist and tutor make me a strong candidate for any role and I am excited to see where my career will take me next.
8+ Reviews
22+ Question Solved
Related Book For 

Applied Calculus
ISBN: 9781119275565
6th Edition
Authors: Deborah Hughes Hallett, Patti Frazer Lock, Andrew M. Gleason, Daniel E. Flath, Sheldon P. Gordon, David O. Lomen, David Lovelock, William G. McCallum, Brad G. Osgood, Andrew Pasquale
Question Posted:
