

Question: Figure 8 shows a supply curve for a commodity. It gives the relationship between the selling price of the commodity and the quantity that producers
Figure 8 shows a supply curve for a commodity. It gives the relationship between the selling price of the commodity and the quantity that producers will manufacture. At a higher selling price, a greater quantity will be produced. Therefore, the curve is increasing. If (A, B) is a point on the curve, then, to stimulate the production of A units of the commodity, the price per unit must be B dollars. Of course, some producers will be willing to produce the commodity even with a lower selling price. Since everyone receives the same price in an open efficient economy, most producers are receiving more than their minimal required price. The excess is called the producers’ surplus. Using an argument analogous to that of the consumers’ surplus, we can show that the total producers’ surplus when the price is B is the area of the shaded region in Fig. 8. Find the producers’ surplus for each of the following supply curves at the given sales level, x.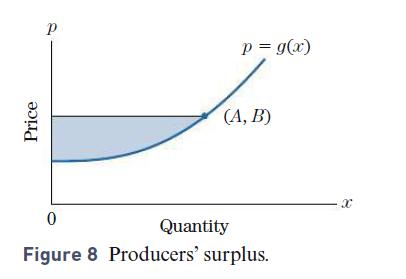
p = .01x + 3; x = 200
Price p = g(x) (A, B) 0 Figure 8 Producers' surplus. Quantity X
Step by Step Solution
3.34 Rating (154 Votes )
There are 3 Steps involved in it
p200 001200 3 5 ... View full answer

Get step-by-step solutions from verified subject matter experts