

Figure 8.29 shows the contours of the amount, C, in mg, of medication in the blood stream,
Question:
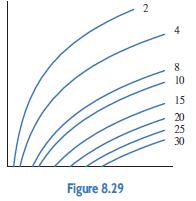
Figure 8.29 shows the contours of the amount, C, in mg, of medication in the blood stream, as a function of the time t since an initial dose D is administered to the patient. Which axis corresponds to the initial dosage?
Fantastic news! We've Found the answer you've been seeking!
Step by Step Answer:
We see that if we fix a value on the horizontal axis and inc...View the full answer

Answered By
Vineet Kumar Yadav
I am a biotech engineer and cleared jee exam 2 times and also i am a math tutor. topper comunity , chegg India, vedantu doubt expert( solving doubt for iit jee student on the online doubt solving app in live chat with student)
2+ Reviews
10+ Question Solved
Related Book For 

Applied Calculus
ISBN: 9781119275565
6th Edition
Authors: Deborah Hughes Hallett, Patti Frazer Lock, Andrew M. Gleason, Daniel E. Flath, Sheldon P. Gordon, David O. Lomen, David Lovelock, William G. McCallum, Brad G. Osgood, Andrew Pasquale
Question Posted:
