

Figure 8.33 shows contours of the function giving the species density of breeding birds at each point
Question:
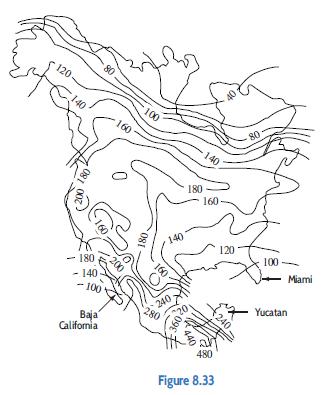
Figure 8.33 shows contours of the function giving the species density of breeding birds at each point in the US, Canada, and Mexico. Are the following statements true or false? Explain your answers.
(a) Moving from south to north across Canada, the species density increases.
(b) In general, peninsulas (for example, Florida, Baja California, the Yucatan) have lower species densities than the areas around them.
(c) The species density around Miami is over 100.
Fantastic news! We've Found the answer you've been seeking!
Step by Step Answer:
a False The values on the level curves are decreasing as you go northward in Canada b True In ...View the full answer

Answered By
Muhammad Ghyas Asif
It is my obligation to present efficient services to my clients by providing a work of quality, unique, competent and relevant. I hope you have confidence in me and assign me the order and i promise to follow all the instructions and keep time.
109+ Reviews
203+ Question Solved
Related Book For 

Applied Calculus
ISBN: 9781119275565
6th Edition
Authors: Deborah Hughes Hallett, Patti Frazer Lock, Andrew M. Gleason, Daniel E. Flath, Sheldon P. Gordon, David O. Lomen, David Lovelock, William G. McCallum, Brad G. Osgood, Andrew Pasquale
Question Posted:
