

Figure 8.42 shows a contour plot of job satisfaction as a function of the hourly wage and
Question:
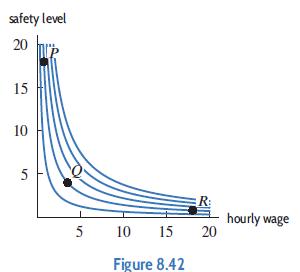
Figure 8.42 shows a contour plot of job satisfaction as a function of the hourly wage and the safety of the workplace (higher values mean safer). Match the jobs at points P, Q, and R with the three descriptions.
(a) The job is so unsafe that higher pay alone would not increase my satisfaction very much.
(b) I could trade a little less safety for a little more pay. It would not matter to me.
(c) The job pays so little that improving safety would not make me happier.
Fantastic news! We've Found the answer you've been seeking!
Step by Step Answer:
a R The contour through R is nearly horizontal Moving to the right on the co...View the full answer

Answered By
Utsab mitra
I have the expertise to deliver these subjects to college and higher-level students. The services would involve only solving assignments, homework help, and others.
I have experience in delivering these subjects for the last 6 years on a freelancing basis in different companies around the globe. I am CMA certified and CGMA UK. I have professional experience of 18 years in the industry involved in the manufacturing company and IT implementation experience of over 12 years.
I have delivered this help to students effortlessly, which is essential to give the students a good grade in their studies.
2+ Reviews
10+ Question Solved
Related Book For 

Applied Calculus
ISBN: 9781119275565
6th Edition
Authors: Deborah Hughes Hallett, Patti Frazer Lock, Andrew M. Gleason, Daniel E. Flath, Sheldon P. Gordon, David O. Lomen, David Lovelock, William G. McCallum, Brad G. Osgood, Andrew Pasquale
Question Posted:
