

Figure 8.53 is a contour diagram of f(x, y). In each of the following cases, list the
Question:
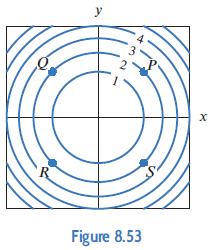
Figure 8.53 is a contour diagram of f(x, y). In each of the following cases, list the marked points in the diagram (there may be none or more than one) at which
(a) fx < 0
(b) fy > 0
(c) fxx > 0
(d) fyy < 0
Fantastic news! We've Found the answer you've been seeking!
Step by Step Answer:
a At QR we have f x 0 because f decreases as we move in the xdirection b At Q P we have f y 0 ...View the full answer

Answered By
Douglas Makokha
Unlock Academic Success with Dedicated Tutoring and Expert Writing Support!
Are you ready to excel in your academics? Look no further! As a passionate tutor, I believe that dedication and hard work are the keys to achieving outstanding results. When it comes to academics, I strive to provide nothing but the best for every student I encounter.
With a relentless thirst for knowledge, I have extensively researched numerous subjects and topics, equipping myself with a treasure trove of answers to tackle any question that comes my way. With four years of invaluable experience, I have mastered the art of unraveling even the most intricate problems. Collaborating with esteemed writers has granted me exclusive access to the trade secrets utilized by the industry's top professionals.
Allow me the pleasure of assisting you with your writing assignments. I thrive on challenges and will guide you through any obstacles you may face. Together, we will unlock your academic potential and pave the way for your success.
60+ Reviews
341+ Question Solved
Related Book For 

Applied Calculus
ISBN: 9781119275565
6th Edition
Authors: Deborah Hughes Hallett, Patti Frazer Lock, Andrew M. Gleason, Daniel E. Flath, Sheldon P. Gordon, David O. Lomen, David Lovelock, William G. McCallum, Brad G. Osgood, Andrew Pasquale
Question Posted:
