

In 1913, Carlson conducted the classic experiment in which he grew yeast, Saccharomyces cerevisiae, in laboratory cultures
Question:
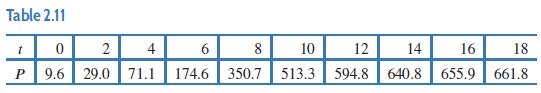
In 1913, Carlson conducted the classic experiment in which he grew yeast, Saccharomyces cerevisiae, in laboratory cultures and collected data every hour for 18 hours. Table 2.11 shows the yeast population, P, at representative times t in hours.
(a) Calculate the average rate of change of P per hour for the time intervals shown between 0 and 18 hours.
(b) What can you say about the sign of d2P∕dt2 during the period 0–18 hours?
Fantastic news! We've Found the answer you've been seeking!
Step by Step Answer:
a For each time interval we can calculate the average ...View the full answer

Answered By
Fahmin Arakkal
Tutoring and Contributing expert question and answers to teachers and students.
Primarily oversees the Heat and Mass Transfer contents presented on websites and blogs.
Responsible for Creating, Editing, Updating all contents related Chemical Engineering in
latex language
8+ Reviews
22+ Question Solved
Related Book For 

Applied Calculus
ISBN: 9781119275565
6th Edition
Authors: Deborah Hughes Hallett, Patti Frazer Lock, Andrew M. Gleason, Daniel E. Flath, Sheldon P. Gordon, David O. Lomen, David Lovelock, William G. McCallum, Brad G. Osgood, Andrew Pasquale
Question Posted:
