

Question: In an experiment, a lizard is encouraged to run as fast as possible. Figure 1.47 shows the distance run in meters as a function of
In an experiment, a lizard is encouraged to run as fast as possible. Figure 1.47 shows the distance run in meters as a function of the time in seconds.
(a) If the lizard were running faster and faster, what would be the concavity of the graph? Does this match what you see?
(b) Estimate the average velocity of the lizard during this 0.8 second experiment.
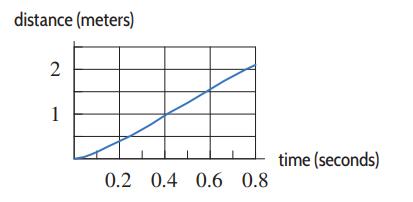
distance (meters) 2 1 0.2 0.4 0.6 0.8 time (seconds)
Step by Step Solution
3.40 Rating (166 Votes )
There are 3 Steps involved in it
a If the lizard were running faster and faster the graph would be con... View full answer

Get step-by-step solutions from verified subject matter experts