

One of Tables 1.28 and 1.29 represents a supply curve; the other represents a demand curve. (a)
Question:
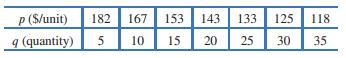
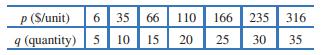
One of Tables 1.28 and 1.29 represents a supply curve; the other represents a demand curve.
(a) Which table represents which curve? Why?
(b) At a price of $155, approximately how many items would consumers purchase?
(c) At a price of $155, approximately how many items would manufacturers supply?
(d) Will the market push prices higher or lower than $155?
(e) What would the price have to be if you wanted consumers to buy at least 20 items?
(f) What would the price have to be if you wanted manufacturers to supply at least 20 items?
Tables 1.28
 Tables 1.29
Step by Step Answer:
a We know that as the price per unit increases the quantity ...View the full answer


Applied Calculus
ISBN: 9781119275565
6th Edition
Authors: Deborah Hughes Hallett, Patti Frazer Lock, Andrew M. Gleason, Daniel E. Flath, Sheldon P. Gordon, David O. Lomen, David Lovelock, William G. McCallum, Brad G. Osgood, Andrew Pasquale
