

Question: Problems refer to Figure 2.38, which shows the depletion of food stores in the human body during starvation. Figure 2.39 shows the derivatives of the
Problems refer to Figure 2.38, which shows the depletion of food stores in the human body during starvation.
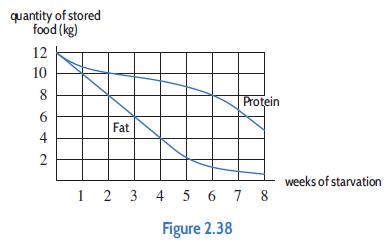
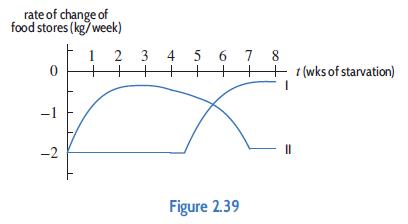
Figure 2.39 shows the derivatives of the protein and fat storage functions. Which graph is which?
quantity of stored food (kg) 12 10 8 6 4 2 Fat 1 2 3 3 Protein 4 5 6 7 8 Figure 2.38 weeks of starvation
Step by Step Solution
★★★★★
3.59 Rating (160 Votes )
There are 3 Steps involved in it
1 Expert Approved Answer
Step: 1 Unlock

The graph of fat storage is linear for four weeks then becomes concave up T... View full answer
Question Has Been Solved by an Expert!
Get step-by-step solutions from verified subject matter experts
Step: 2 Unlock
Step: 3 Unlock