

Question: Refer to the graph in Fig. 11. Draw the rectangles that approximate the area under the curve from 0 to 8 when using the midpoint
Refer to the graph in Fig. 11. Draw the rectangles that approximate the area under the curve from 0 to 8 when using the midpoint rule with n = 4.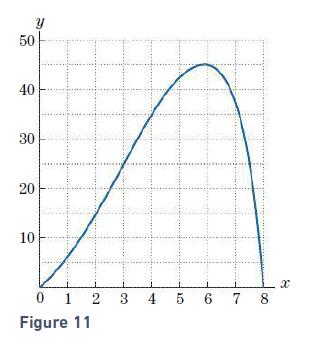
Y 50 40 30 20 10 0 1 2 3 4 5 6 7 8 Figure 11
Step by Step Solution
★★★★★
3.41 Rating (164 Votes )
There are 3 Steps involved in it
1 Expert Approved Answer
Step: 1 Unlock

50 40 3... View full answer
Question Has Been Solved by an Expert!
Get step-by-step solutions from verified subject matter experts
Step: 2 Unlock
Step: 3 Unlock