

Question: Supply and demand data are in Tables 6.3 and 6.4. (a) Which table shows supply and which shows demand? (b) Estimate the equilibrium price and
Supply and demand data are in Tables 6.3 and 6.4.
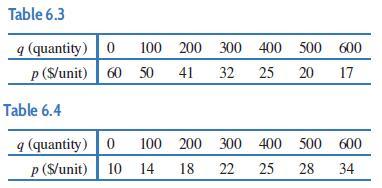
(a) Which table shows supply and which shows demand?
(b) Estimate the equilibrium price and quantity.
(c) Estimate the consumer and producer surplus.
Table 6.3 q (quantity) p (S/unit) 60 50 50 Table 6.4 0 100 200 300 400 500 q (quantity) p ($/unit) 600 41 32 25 20 17 0 100 200 300 400 500 10 10 14 600 18 22 25 28 34
Step by Step Solution
★★★★★
3.46 Rating (159 Votes )
There are 3 Steps involved in it
1 Expert Approved Answer
Step: 1 Unlock

a In Table 63 the quantity q increases as the price p decreases while in Table 64 q increases as p i... View full answer
Question Has Been Solved by an Expert!
Get step-by-step solutions from verified subject matter experts
Step: 2 Unlock
Step: 3 Unlock