

Table 1.18 shows the production of tobacco in the US. (a) What is the average rate of
Question:
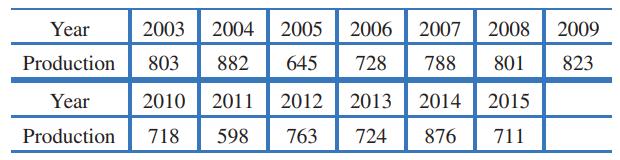
Table 1.18 shows the production of tobacco in the US.
(a) What is the average rate of change in tobacco production between 2003 and 2015? Give units and interpret your answer in terms of tobacco production.
(b) During this twelve-year period, are there any one-year intervals during which the average rate of change was positive? If so, when?
Table 1.18 Tobacco production, in millions of pounds
Fantastic news! We've Found the answer you've been seeking!
Step by Step Answer:
a The average rate of change R is the difference in amounts divided by the ch...View the full answer

Answered By
Pushpinder Singh
Currently, I am PhD scholar with Indian Statistical problem, working in applied statistics and real life data problems. I have done several projects in Statistics especially Time Series data analysis, Regression Techniques.
I am Master in Statistics from Indian Institute of Technology, Kanpur.
I have been teaching students for various University entrance exams and passing grades in Graduation and Post-Graduation.I have expertise in solving problems in Statistics for more than 2 years now.I am a subject expert in Statistics with Assignmentpedia.com.
3+ Reviews
10+ Question Solved
Related Book For 

Applied Calculus
ISBN: 9781119275565
6th Edition
Authors: Deborah Hughes Hallett, Patti Frazer Lock, Andrew M. Gleason, Daniel E. Flath, Sheldon P. Gordon, David O. Lomen, David Lovelock, William G. McCallum, Brad G. Osgood, Andrew Pasquale
Question Posted:
