

Question: Table 1.30 gives data for the linear demand curve for a product, where p is the price of the product and q is the quantity
Table 1.30 gives data for the linear demand curve for a product, where p is the price of the product and q is the quantity sold every month at that price. Find formulas for the following functions. Interpret their slopes in terms of demand.
(a) q as a function of p.
(b) p as a function of q.
Table 1.30
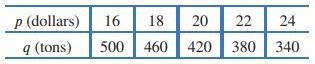
p (dollars) 16 16 18 20 22 24 q (tons) 500 460 420 380 340
Step by Step Solution
★★★★★
3.32 Rating (164 Votes )
There are 3 Steps involved in it
1 Expert Approved Answer
Step: 1 Unlock

a If we think of q as a linear function of p then q is the dependent variable p is the independent v... View full answer
Question Has Been Solved by an Expert!
Get step-by-step solutions from verified subject matter experts
Step: 2 Unlock
Step: 3 Unlock