

Table 6.2 shows the monthly change in water stored in Lake Sonoma, California, from March through November
Question:
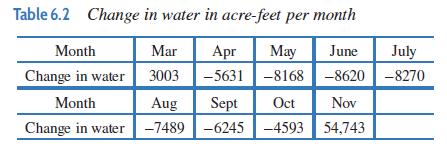
Table 6.2 shows the monthly change in water stored in Lake Sonoma, California, from March through November 2014. The change is measured in acre-feet per month.1 On March 1, the water stored was 182,566 acre-feet. Let S(t) be the total water, in acre-feet, stored in month t, where t = 0 is March.
(a) Find and interpret S(0) and S(3).
(b) Approximately when do maximum and minimum values of S(t) occur?
(c) Does S(t) appear to have inflection points? If so, approximately when?
Fantastic news! We've Found the answer you've been seeking!
Step by Step Answer:
a The water stored in Lake Sonoma on March 1 2014 is S0 182566 acrefeet Since t 3 is June 1 we find ...View the full answer

Answered By
PALASH JHANWAR
I am a Chartered Accountant with AIR 45 in CA - IPCC. I am a Merit Holder ( B.Com ). The following is my educational details.
PLEASE ACCESS MY RESUME FROM THE FOLLOWING LINK: https://drive.google.com/file/d/1hYR1uch-ff6MRC_cDB07K6VqY9kQ3SFL/view?usp=sharing
3+ Reviews
10+ Question Solved
Related Book For 

Applied Calculus
ISBN: 9781119275565
6th Edition
Authors: Deborah Hughes Hallett, Patti Frazer Lock, Andrew M. Gleason, Daniel E. Flath, Sheldon P. Gordon, David O. Lomen, David Lovelock, William G. McCallum, Brad G. Osgood, Andrew Pasquale
Question Posted:
