

The following table gives the percentage, P, of households with cable television between 1977 and 2003.(a) Explain
Question:
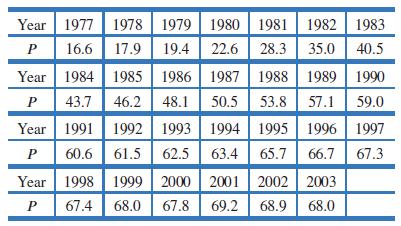
The following table gives the percentage, P, of households with cable television between 1977 and 2003.(a) Explain why a logistic model is reasonable for this data.(b) Estimate the point of diminishing returns. What limiting value L does this point predict? Does this limiting value appear to be accurate, given the percentages for 2002 and 2003?(c) If t is in years since 1977, the best fitting logistic function for this data turns out to be
![]()
What limiting value does this function predict?(d) Explain in terms of percentages of households what the limiting value is telling you. Do you think your answer to part (c) is an accurate prediction?
Step by Step Answer:
a If we graph the data we see that it looks like logistic growth See Figure 4129 But logistic ...View the full answer


Applied Calculus
ISBN: 9781119275565
6th Edition
Authors: Deborah Hughes Hallett, Patti Frazer Lock, Andrew M. Gleason, Daniel E. Flath, Sheldon P. Gordon, David O. Lomen, David Lovelock, William G. McCallum, Brad G. Osgood, Andrew Pasquale
