

Question: The function A(t) in Fig. 2(a) gives the balance in a savings account after t years with interest compounded continuously. Figure 2(b) shows the derivative
The function A(t) in Fig. 2(a) gives the balance in a savings account after t years with interest compounded continuously. Figure 2(b) shows the derivative of A(t).
(a) What is the balance after 20 years?
(b) How fast is the balance increasing after 20 years?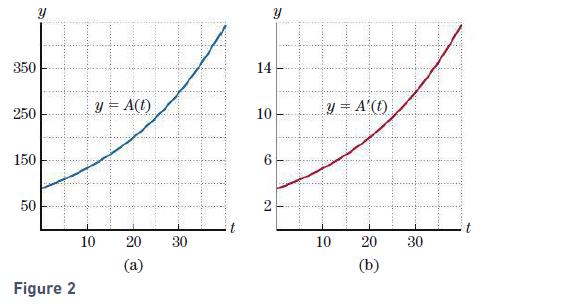
(c) Use the answers to parts (a) and (b) to determine the interest rate.
(d) When is the balance $300?
(e) When is the balance increasing at the rate of $12 per year?
(f) Why do the graphs of A(t) and A(t) look the same?
Y 350 250 150 50 Figure 2 y = A(t) 10 20 (a) 30 a 14 10 6 2 y = A'(t) 10 20 (b) 30
Step by Step Solution
3.29 Rating (155 Votes )
There are 3 Steps involved in it
a From the graph in Fig 2a the balance will be 200 b From the ... View full answer

Get step-by-step solutions from verified subject matter experts