

Question: The graph of a cost function is given in Figure 4.66. (a) At q = 25, estimate the following quantities and represent your answers graphically.
The graph of a cost function is given in Figure 4.66.
(a) At q = 25, estimate the following quantities and represent your answers graphically.
(i) Average cost (ii) Marginal cost
(b) At approximately what value of q is average cost minimized?
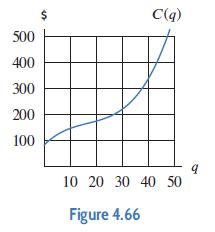
500 400 300 200 100 S C(q) 10 20 30 40 50 Figure 4.66 9
Step by Step Solution
★★★★★
3.47 Rating (173 Votes )
There are 3 Steps involved in it
1 Expert Approved Answer
Step: 1 Unlock

a i The average cost of quantity q is given by the formula Cqq So average cost at q 25 is given by C... View full answer
Question Has Been Solved by an Expert!
Get step-by-step solutions from verified subject matter experts
Step: 2 Unlock
Step: 3 Unlock