

Question: The graphs of y = x + ln x and y = ln 2x are shown in Fig. 6. (a) Show that both functions are
The graphs of y = x + ln x and y = ln 2x are shown in Fig. 6.
(a) Show that both functions are increasing for x > 0.
(b) Find the point of intersection of the graphs.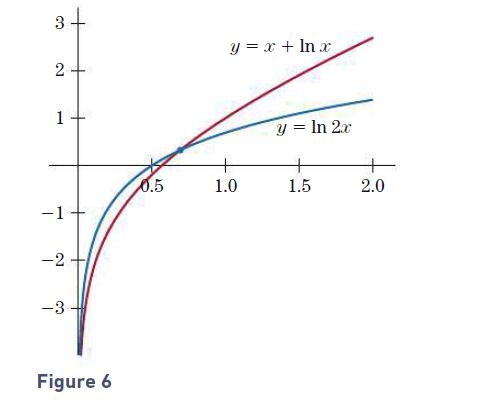
2 1 -2. -3 Figure 6 0.5 y = x + ln x 1.0 y = ln 2x + 1.5 + 2.0
Step by Step Solution
★★★★★
3.49 Rating (166 Votes )
There are 3 Steps involved in it
1 Expert Approved Answer
Step: 1 Unlock

a The first derivative is positive for all values of x ... View full answer
Question Has Been Solved by an Expert!
Get step-by-step solutions from verified subject matter experts
Step: 2 Unlock
Step: 3 Unlock