

Question: The six graphs in Figure 1.16 show frequently observed patterns of age-specific cancer incidence rates, in number of cases per 1000 people, as a function
The six graphs in Figure 1.16 show frequently observed patterns of age-specific cancer incidence rates, in number of cases per 1000 people, as a function of age. The scales on the vertical axes are equal.
(a) For each of the six graphs, write a sentence explaining the effect of age on the cancer rate.
(b) Which graph shows a relatively high incidence rate for children? Suggest a type of cancer that behaves this way.
(c) Which graph shows a brief decrease in the incidence rate at around age 50? Suggest a type of cancer that might behave this way.
(d) Which graph or graphs might represent a cancer that is caused by toxins which build up in the body over time? (For example, lung cancer.) Explain.
Figure 1.16
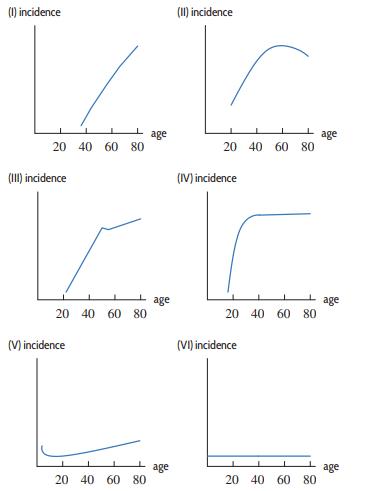
(1) incidence 20 40 60 80 (III) incidence 20 40 60 80 (V) incidence 20 40 60 80 age age age (II) incidence 1 I 20 40 60 80 (IV) incidence 20 40 60 80 (VI) incidence 20 40 60 80 age age age
Step by Step Solution
3.47 Rating (160 Votes )
There are 3 Steps involved in it
a I The incidence of cancer increase with age but the rate of increase slows down slightly The graph ... View full answer

Get step-by-step solutions from verified subject matter experts