

Use Figure 1.25 showing how the quantity, Q, of grass (kg/hectare) in different parts of Namibia depended
Question:
Use Figure 1.25 showing how the quantity, Q, of grass (kg/hectare) in different parts of Namibia depended on the average annual rainfall, r, (mm), in two different years.
Figure 1.25
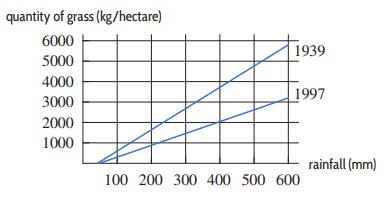
(a) For 1997, find the slope of the line, including units.
(b) Interpret the slope in this context.
(c) Find the equation of the line.
Fantastic news! We've Found the answer you've been seeking!
Step by Step Answer:
a Reading coordinates from the graph we see that ra...View the full answer

Answered By
Pushpinder Singh
Currently, I am PhD scholar with Indian Statistical problem, working in applied statistics and real life data problems. I have done several projects in Statistics especially Time Series data analysis, Regression Techniques.
I am Master in Statistics from Indian Institute of Technology, Kanpur.
I have been teaching students for various University entrance exams and passing grades in Graduation and Post-Graduation.I have expertise in solving problems in Statistics for more than 2 years now.I am a subject expert in Statistics with Assignmentpedia.com.
3+ Reviews
10+ Question Solved
Related Book For 

Applied Calculus
ISBN: 9781119275565
6th Edition
Authors: Deborah Hughes Hallett, Patti Frazer Lock, Andrew M. Gleason, Daniel E. Flath, Sheldon P. Gordon, David O. Lomen, David Lovelock, William G. McCallum, Brad G. Osgood, Andrew Pasquale
Question Posted:
