

Question: Which one of the graphs in Fig. 18 could represent a function f(x) for which f(a) > 0, f(a) = 0, and f(a) < 0?
Which one of the graphs in Fig. 18 could represent a function f(x) for which f(a) > 0, f′(a) = 0, and f″(a) < 0?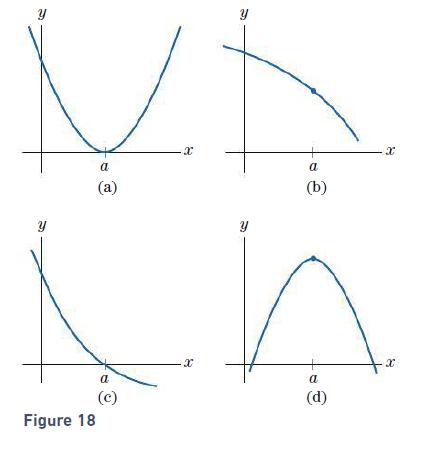
y Figure 18 a (a) a (c) X X fi a (b) a (d) x X
Step by Step Solution
★★★★★
3.29 Rating (167 Votes )
There are 3 Steps involved in it
1 Expert Approved Answer
Step: 1 Unlock

Question Has Been Solved by an Expert!
Get step-by-step solutions from verified subject matter experts
Step: 2 Unlock
Step: 3 Unlock