

Question: World milk production rose at an approximately constant rate between 2000 and 2012. See Figure 1.27. (a) Estimate the vertical intercept and interpret it in
World milk production rose at an approximately constant rate between 2000 and 2012. See Figure 1.27.
(a) Estimate the vertical intercept and interpret it in terms of milk production.
(b) Estimate the slope and interpret it in terms of milk production.
(c) Give an approximate formula for milk production, M, as a function of t.
Figure 1.27
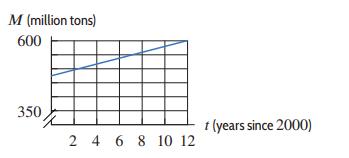
M (million tons) 600 350 2 4 6 8 10 12 t (years since 2000)
Step by Step Solution
3.44 Rating (157 Votes )
There are 3 Steps involved in it
a The vertical intercept appears to be about 480 In 2000 world milk produ... View full answer

Get step-by-step solutions from verified subject matter experts