

Question: The butterfly curve from Prob. 2.22 can also be represented in polar coordinates as Generate values of r for values of from 0 to
The butterfly curve from Prob. 2.22 can also be represented in polar coordinates as
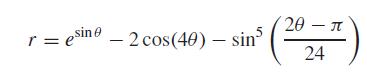
Generate values of r for values of θ from 0 to 8π withΔθ = π/32. Use the MATLAB function polar to generate the polar plot of the butterfly curve with a dashed red line. Employ the MATLAB Help to understand how to generate the plot.
In Problem 2.22The butterfly curve is given by the following parametric equations:
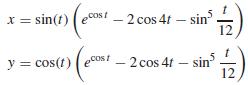
Generate values of x and y for values of t from 0 to 100 with Δt = 1/16. Construct plots of (a) x and y versus t (b) y versus x. Use subplot to stack these plots vertically and make the plot in (b) square. Include titles and axis labels on both plots and a legend for (a). For (a), employ a dotted line for y in order to distinguish it from x.
T = esine - 2 cos(40) - sin 20 - T 24
Step by Step Solution
3.40 Rating (153 Votes )
There are 3 Steps involved in it
ANSWER To generate the polar plot of the butterfly curve using MATLAB you can follo... View full answer

Get step-by-step solutions from verified subject matter experts