

Question: Draw a ridge trace for the accompanying data. Variable Case X1 X2 X3 Y 12345678 0.46 0.96 6.42 3.46 0.06 0.53 5.53 2.25 1.49 1.87
Draw a ridge trace for the accompanying data.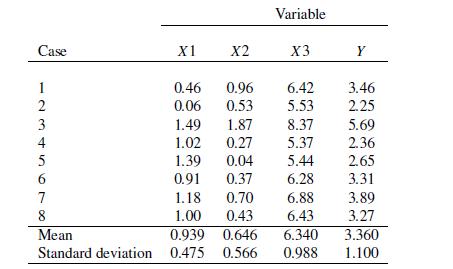
Variable Case X1 X2 X3 Y 12345678 0.46 0.96 6.42 3.46 0.06 0.53 5.53 2.25 1.49 1.87 8.37 5.69 1.02 0.27 5.37 2.36 1.39 0.04 5.44 2.65 0.91 0.37 6.28 3.31 1.18 0.70 6.88 3.89 8 Mean Standard deviation 0.475 0.566 1.00 0.43 6.43 3.27 0.939 0.646 6.340 3.360 0.988 1.100
Step by Step Solution
There are 3 Steps involved in it
1 Expert Approved Answer
Step: 1 Unlock

Question Has Been Solved by an Expert!
Get step-by-step solutions from verified subject matter experts
Step: 2 Unlock
Step: 3 Unlock