

Figure 9.50 shows the results of a study about the annual revenue from different household types in
Question:
Figure 9.50 shows the results of a study about the annual revenue from different household types in a supermarket chain. What was studied and how are the results to be interpreted?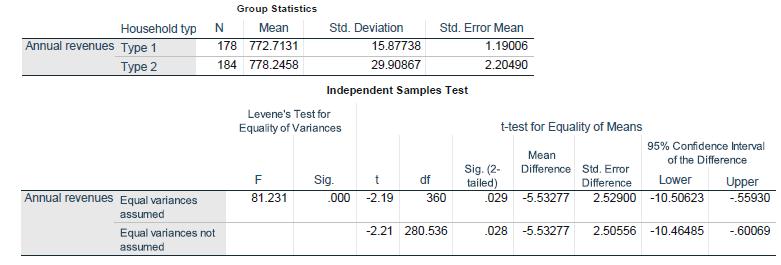
Fantastic news! We've Found the answer you've been seeking!
Step by Step Answer:
The study investigated whether the average annual revenues of two househol...View the full answer

Answered By
Sheikh Muhammad Ibrahim
During the course of my study, I have worked as a private tutor. I have taught Maths and Physics to O'Level and A'Level students, as well as I have also taught basic engineering courses to my juniors in the university. Engineering intrigues me alot because it a world full of ideas. I have passionately taught students and this made me learn alot. Teaching algebra and basic calculus, from the very basics of it made me very patient. Therefore, I know many tricks to make your work easier for you. I believe that every student has a potential to work himself. I am just here to polish your skills. I am a bright student in my university. My juniors are always happy from me because I help in their assignments and they are never late.
14+ Reviews
24+ Question Solved
Related Book For 
Applied Statistics And Multivariate Data Analysis For Business And Economics
ISBN: 9783030177669
1st Edition
Authors: Thomas Cleff
Question Posted:
