

The following table presents price and sales trends for consumer goods A, B, C, and D in
Question:
The following table presents price and sales trends for consumer goods A, B, C, and D in years 1 and 3.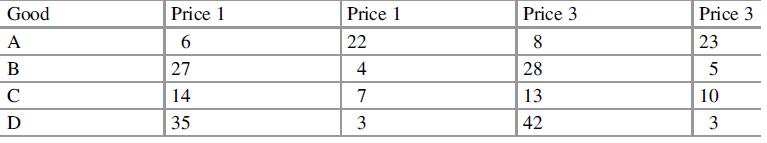
(a) Calculate the Laspeyres price and quantity indices for reporting year 3 using base year 1. Interpret your results.
(b) Calculate the Paasche price and quantity indices for reporting year 3 using base year 1. Interpret your results.
(c) Why is the inflation indicated by the Paasche index usually lower?
(d) Calculate the Fisher price and quantity indices for reporting year 3 using base year 1.
(e) Calculate and interpret the value index for reporting year 3 using base year 1.
(f) What is the per cent of annual price increase after calculating the Laspeyres price index?
Fantastic news! We've Found the answer you've been seeking!
Step by Step Answer:
a The inflation rate between the 2 years is 14 During the same period sales of the four go...View the full answer

Answered By
Pushpinder Singh
Currently, I am PhD scholar with Indian Statistical problem, working in applied statistics and real life data problems. I have done several projects in Statistics especially Time Series data analysis, Regression Techniques.
I am Master in Statistics from Indian Institute of Technology, Kanpur.
I have been teaching students for various University entrance exams and passing grades in Graduation and Post-Graduation.I have expertise in solving problems in Statistics for more than 2 years now.I am a subject expert in Statistics with Assignmentpedia.com.
3+ Reviews
10+ Question Solved
Related Book For 

Applied Statistics And Multivariate Data Analysis For Business And Economics
ISBN: 9783030177669
1st Edition
Authors: Thomas Cleff
Question Posted:
