

Question: Using a statistical package of your choice, create a hypothetical data set which you will use for exercises in this chapter and some of the
Using a statistical package of your choice, create a hypothetical data set which you will use for exercises in this chapter and some of the following chapters. Begin by generating 100 independent cases for each of ten variables using the standard normal distribution (means =
0 and variances = 1). Call the new variables X1;X2; : : : ;X9;Y. Use the following seeds in generating these 100 cases.
X1 seed 36541 X2 seed 43893 X3 seed 45671 X4 seed 65431 X5 seed 98753 X6 seed 78965 X7 seed 67893 X8 seed 34521 X9 seed 98431 Y seed 67895 You now have ten independent, random, normal numbers for each of 100 cases. The population mean is 0 and the population standard deviation is 1. Further transformations are done to make the variables intercorrelated. The transformations are accomplished by making some of the variables functions of other variables, as follows:
X1 = 5*X1 X2 = 3*X2 X3 = X1 + X2 + 4*X3 X4 = X4 X5 = 4*X5 X6 = X5 ???? X4 + 6*X6 X7 = 2*X7 X8 = X7 + 2*X8 X9 = 4*X9 Y = 5 + X1 + 2*X2 + X3 + 10*Y We now have created a random sample of 100 cases on 10 variables: X1;X2;X3;X4;X5;X6;X7;
X8;X9;Y. The population distribution is multivariate normal. It can be shown that the population means and variances are as follows: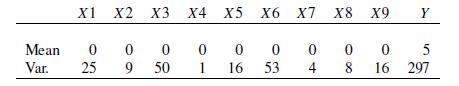
The population correlation matrix is as follows: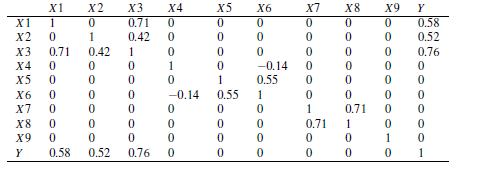
The population squared multiple correlation coefficient between Y and X1 and X9 is 0.34, between Y and X1;X2;X3 is 0.66, and between Y and X4 and X9 is zero. Also, the population regression line of Y on X1 to X9 has a = 5;b1 = 1;b2 = 2;b3 = 1;b4 = b5 = = b9 = 0.
Now, using the data you have generated, obtain the sample statistics from a computer packaged program, and compare them with the parameters given above. Using the Bonferroni inequality, test the simple correlations, and determine which are significantly different from zero. Comment.
X1 X2 X3 X4 X5 X6 X6 X7 X7 X8 X9 Y Mean 0 0 0 0 0 0 0 0 0 5 Var. 25 9 50 1 16 53 4 8 16 297
Step by Step Solution
There are 3 Steps involved in it

Get step-by-step solutions from verified subject matter experts