

What was tested in the procedure represented in Fig. 9.54? Interpret the results. Age Age t -2.490
Question:
What was tested in the procedure represented in Fig. 9.54? Interpret the results.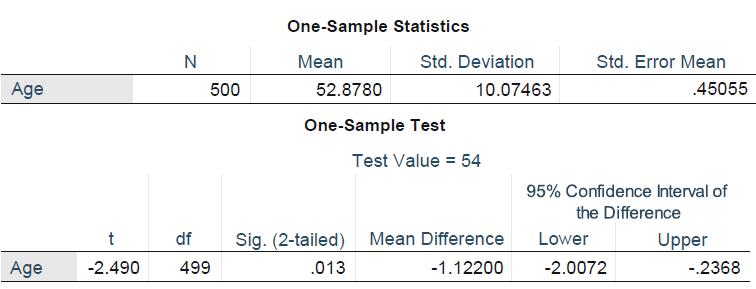
Fantastic news! We've Found the answer you've been seeking!
Step by Step Answer:
A onesample ttest was used to see whether the average age in a population differs from 54 years T...View the full answer

Answered By
Jacob Festus
I am a professional Statistician and Project Research writer. I am looking forward to getting mostly statistical work including data management that is analysis, data entry using all the statistical software’s such as R Gui, R Studio, SPSS, STATA, and excel. I also have excellent knowledge of research and essay writing. I have previously worked in other Freelancing sites such as Uvocorp, Essay shark, Bluecorp and finally, decided to join the solution inn team to continue with my explicit work of helping dear clients and students achieve their Academic dreams. I deliver, quality and exceptional projects on time and capable of working under high pressure.
1250+ Reviews
2838+ Question Solved
Related Book For 
Applied Statistics And Multivariate Data Analysis For Business And Economics
ISBN: 9783030177669
1st Edition
Authors: Thomas Cleff
Question Posted:
