

Question: An article in Technometrics by S. C. Narula and J. F. Wellington [Prediction, Linear Regression, and a Minimum Sum of Relative Errors (1977, Vol. 19)]
Table 6E.7
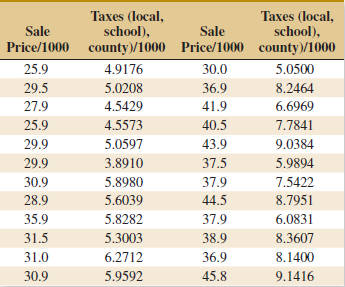
(a) Construct a scatter plot of sales price versus taxes paid. Comment on the widely held belief that price is related to taxes paid.
(b) What is the simple correlation coefficient between these two variables?
Taxes (local, school), Taxes (local, school), Sale Sale Price/1000 county)/1000 Price/1000 county)/1000 4.9176 25.9 30.0 5.0500 29.5 36.9 5.0208 8.2464 27.9 4.5429 41.9 6.6969 40.5 25.9 4.5573 7.7841 29.9 5.0597 43.9 9.0384 29.9 3.8910 37.5 5.9894 30.9 5.8980 37.9 7.5422 44.5 28.9 5.6039 8.7951 5.8282 37.9 35.9 6.0831 31.5 38.9 5.3003 8.3607 36.9 31.0 6.2712 8.1400 30.9 5.9592 45.8 9.1416
Step by Step Solution
3.53 Rating (174 Votes )
There are 3 Steps involved in it
a As the taxes increase the price ten... View full answer

Get step-by-step solutions from verified subject matter experts