

Question: Consider the data in Exercise 15-10. Calculate the sample standard deviation of all 100 measurements and compare this result to the estimate of obtained
Consider the data in Exercise 15-10. Calculate the sample standard deviation of all 100 measurements and compare this result to the estimate of σ obtained from your revised X̅ and R charts. Explain any differences.
Exercise 15-10
The following data were considered in Quality Engineering [€œAn SPC Case Study on Stabilizing Syringe Lengths€ (1999€“2000, Vol. 12(1))]. The syringe length is measured during a pharmaceutical manufacturing process. The following table provides data (in inches) for 20 samples each of size 5.
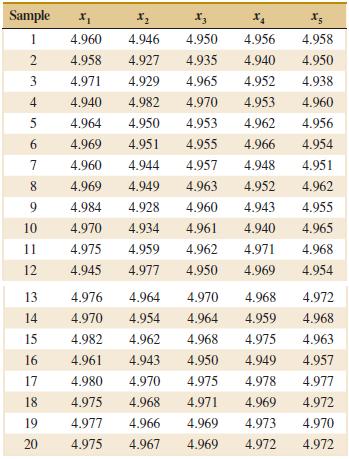
Sample X3 4.960 4.946 4.950 4.956 4.958 4.940 2 4.958 4.927 4.935 4.950 4.929 3 4.971 4.965 4.952 4.938 4.940 4.982 4.970 4.953 4.960 4.953 4.962 5 4.964 4.950 4.956 4.969 4.954 6. 4.951 4.955 4.966 4.957 4.960 4.944 4.948 4.951 4.963 4.952 4.962 8. 4.969 4.949 9. 4.984 4.928 4.960 4.943 4.955 10 4.970 4.934 4.961 4.940 4.965 4.968 11 4.975 4.959 4.962 4.971 4.950 12 4.945 4.977 4.969 4.954
Step by Step Solution
3.34 Rating (166 Votes )
There are 3 Steps involved in it
The sample standard deviation is00127 ... View full answer

Get step-by-step solutions from verified subject matter experts