

Question: Consider the foam thickness data from Exercise 10-39. Is there any indication that the variances of foam thickness are different at the two different levels
Exercise 10-39
An article in Polymer Degradation and Stability (2006, Vol. 91) presented data from a nine-year aging study on S537 foam. Foam samples were compressed to 50% of their original thickness and stored at different temperatures for nine years. At the start of the experiment as well as during each year, sample thickness was measured, and the thicknesses of the eight samples at each storage condition were recorded. The data for two storage conditions follow.
(a) Is there evidence to support the claim that mean compression increases with the temperature at the storage condition?
(b) Find a 95% confidence interval for the difference in the mean compression for the two temperatures.
(c) Is the value zero contained in the 95% confidence interval? Explain the connection with the conclusion you reached in part (a).
(d) Do normal probability plots of compression indicate any violations of the assumptions for the tests and confidence interval that you performed?
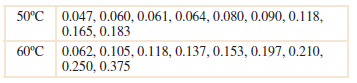
50C 0.047, 0.060, 0.061, 0.064, 0.080, 0.090, 0.118, 0.165, 0.183 60C 0.062, 0.105, 0.118, 0.137, 0.153, 0.197, 0.210, 0.250, 0.375
Step by Step Solution
3.36 Rating (162 Votes )
There are 3 Steps involved in it
1 The parameters of interest are the foam thickness variances 1 2 2 2 2 H 0 1 2 2 ... View full answer

Get step-by-step solutions from verified subject matter experts