

Question: Consider the infectious-waste data in Exercise 15-26. Use the data after the process change only. (a) Construct an CUSUM control chart with the target equal
(a) Construct an CUSUM control chart with the target equal to the estimated process mean, k = 0.5, and h = 4. Does the process appear to be in control at the target?
(b) If the mean increases by 1.0 lb, approximate the ARL of the chart.
Exercise 15-26
An article in Quality & Safety in Health Care [€œStatistical Process Control as a Tool for Research and Healthcare Improvement,€ (2003) considered a number of control charts in healthcare. An X chart was constructed for the amount of infectious waste discarded each day (in pounds). The article mentions that improperly classified infectious waste (actually not hazardous) adds substantial costs to hospitals each year. The following tables show approximate data for the average daily waste per month before and after process changes, respectively. The process change included an education campaign to provide an operational definition for infectious waste.
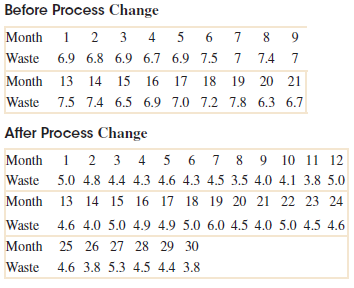
Before Process Change 2 3 Month 1 4 5 9. Waste 6.9 6.8 6.9 6.7 6.9 7.5 7.4 7 Month 13 14 15 16 17 18 19 20 21 Waste 7.5 7.4 6.5 6.9 7.0 7.2 7.8 6.3 6.7 After Process Change Month 1 2 3 4 5 6 7 8 9 10 11 12 Waste 5.0 4.8 4.4 4.3 4.6 4.3 4.5 3.5 4.0 4.1 3.8 5.0 Month 13 14 15 16 17 18 19 20 21 22 23 24 Waste 4.6 4.0 5.0 4.9 4.9 5.0 6.0 4.5 4.0 5.0 4.5 4.6 Month 25 26 27 28 29 30 Waste 4.6 3.8 5.3 4.5 4.4 3.8
Step by Step Solution
3.48 Rating (171 Votes )
There are 3 Steps involved in it
a The CUSUM chart uses the 30 observations after the change The chart provides similar concl... View full answer

Get step-by-step solutions from verified subject matter experts