

Question: Determine the covariance and correlation for the joint probability distribution shown in Fig. 5-10(a) and described in Example 5-10. In figure 5-10 fy(y) 4 0.034
Determine the covariance and correlation for the joint probability distribution shown in Fig. 5-10(a) and described in Example 5-10.
In figure 5-10
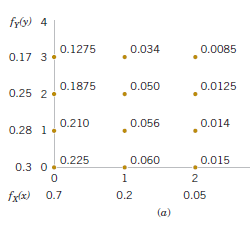
fy(y) 4 0.034 0.1275 0.0085 0.17 3 0.1875 0.050 0.0125 0.25 2 . 0.210 0.056 0.014 0.28 1. 0.225 0.060 0.015 0.3 0. 2 fx(x) 0.7 0.2 0.05 (a)
Step by Step Solution
★★★★★
3.55 Rating (176 Votes )
There are 3 Steps involved in it
1 Expert Approved Answer
Step: 1 Unlock

The marginal distribution of X is X 0 1 2 EX 007510... View full answer
Question Has Been Solved by an Expert!
Get step-by-step solutions from verified subject matter experts
Step: 2 Unlock
Step: 3 Unlock