

Question: Table 6E.5 contains the global mean surface air temperature anomaly and the global CO 2 concentration for the years 18802004. The temperature is measured at
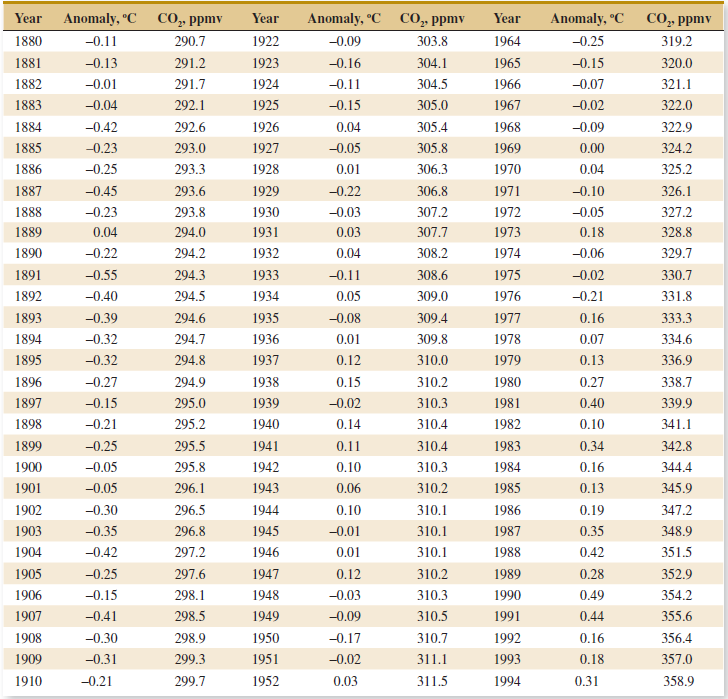
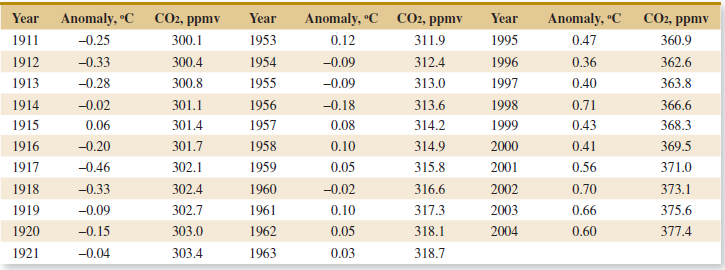
Table 6E.5 contains the global mean surface air temperature anomaly and the global CO2concentration for the years 1880€“2004. The temperature is measured at a number of locations around the world and averaged annually, and then subtracted from a base period average (1951€“1980) and the result reported as an anomaly.
(a) Construct a time series plot of the global mean surface air temperature anomaly data and comment on any features that you observe.
(b) Construct a time series plot of the global CO2 concentration data and comment on any features that you observe.
(c) Overlay the two plots on the same set of axes and comment on the plot.
Table 6E.5 Global Mean Surface Air Temperature Anomaly and Global CO2 Concentration
Anomaly, C CO,, ppmv Year Anomaly, C CO, ppmv Year Anomaly, C CO, ppmv Year 1880 -0.11 -0.25 319.2 290.7 1922 -0.09 303.8 1964 1881 -0.13 291.2 1923 -0.16 304.1 1965 -0.15 320.0 1882 --0.01 291.7 1924 -0.11 304.5 1966 -0.07 321.1 292.1 1925 305.0 1967 322.0 1883 -0.04 -0.15 -0.02 -0.42 1884 292.6 1926 0.04 305.4 1968 -0.09 322.9 1885 293.0 -0.05 1969 -0.23 1927 305.8 0.00 324.2 0.04 325.2 1886 --0.25 293.3 1928 0.01 306.3 1970 1887 -0.45 293.6 1929 -0.22 306.8 1971 -0.10 326.1 307.2 1888 -0.23 293.8 1930 -0.03 1972 -0.05 327.2 0.04 1973 328.8 1889 294.0 1931 0.03 307.7 0.18 0.04 329.7 1890 --0.22 294.2 1932 308.2 1974 -0.06 1891 294.3 1933 308.6 1975 -0.55 -0.11 -0.02 330.7 294.5 1934 0.05 1976 1892 -0.40 309.0 -0.21 331.8 1893 -0.39 1935 1977 294.6 -0.08 309.4 0.16 333.3 1936 309.8 1978 0.07 1894 -0.32 294.7 0.01 334.6 1895 310.0 1979 -0.32 294.8 1937 0.12 0.13 336.9 -0.27 1938 0.15 310.2 1980 1896 294.9 0.27 338.7 1939 1897 -0.15 295.0 -0.02 310.3 1981 0.40 339.9 -0.21 295.2 341.1 1898 1940 0.14 310.4 1982 0.10 -0.25 295.5 1899 1941 0.11 310.4 1983 0.34 342.8 1900 -0.05 295.8 1942 0.10 310.3 1984 0.16 344.4 1943 1901 -0.05 296.1 0.06 310.2 1985 0.13 345.9 1902 0.10 347.2 -0.30 296.5 1944 310.1 1986 0.19 1903 -0.35 296.8 1945 -0.01 310.1 1987 0.35 348.9 1946 0.42 1904 -0.42 297.2 0.01 310.1 1988 351.5 297.6 1905 -0.25 1947 0.12 310.2 1989 0.28 352.9 310.3 354.2 1906 -0.15 298.1 1948 -0.03 1990 0.49 1907 310.5 1991 -0.41 298.5 1949 -0.09 0.44 355.6 -0.17 1992 1908 -0.30 298.9 1950 310.7 0.16 356.4 1993 1909 -0.31 299.3 1951 -0.02 311.1 0.18 357.0 1952 1910 -0.21 299.7 0.03 311.5 1994 0.31 358.9 Year Anomaly, C CO2, ppmv -0.25 -0.33 -0.28 Year 1953 1954 1955 1956 1957 1958 1959 1960 1961 Anomaly, C CO2, ppmv 311.9 312.4 313.0 313.6 314.2 314.9 315.8 Year 1995 1996 1997 1998 1999 2000 2001 2002 2003 Anomaly, C CO2, ppmv 360.9 362.6 363.8 366.6 368.3 0.47 0.36 0.12 -0.09 -0.09 -0.18 1911 1912 1913 1914 1915 1916 300.1 300.4 300.8 301.1 301.4 0.40 -0.02 0.71 0.43 0.06 -0.20 -0.46 0.08 0.10 0.05 369.5 371.0 301.7 302.1 302.4 302.7 0.41 0.56 0.70 1917 1918 -0.33 -0.02 316.6 317.3 318.1 373.1 375.6 1919 -0.09 0.66 0.10 1920 303.0 1962 0.05 2004 0.60 377.4 -0.15 303.4 1963 0.03 318.7 1921 -0.04
Step by Step Solution
3.46 Rating (169 Votes )
There are 3 Steps involved in it
a There is an increasing trend in the most recent data b c ... View full answer

Get step-by-step solutions from verified subject matter experts